“Top 10” Team Metrics…
Published on March 12, 2010 in "Top Ten" Lists | No Comments
…for assessing team readiness – The ability of a team to optimally carry-out its mission.
(rankings are shown in alphabetical order, and are not prioritized)
1. Costs & Expenses
- The second component of profit (or surplus if a not-for-profit), costs & expense are the monies the team or organization must payout to support its activities. Costs & expenses that exceed budget or competitive benchmarks may indicate problems. Profit = Revenue – Costs. Without profit or at least break-even, the business will shut-down.
2. Output
- Percent of jobs completed as compared to the number of jobs that were scheduled to be completed in a given period. Output is a relatively easy metric to calculate, but can be more difficult to analyze. Output problems can often be traced to people issues, process issues, timing issues, or requirements issues.
3. Perfect Job Fulfillment
- A job gets done on time, correctly, as expected, within budget, without incident, and satisfies the customer! This metric considers a number of important factors and may well be the team’s most watched metric.
4. Revenue (or Donations if not-for-profit)
- The first component of profit (or surplus if a not-for-profit), revenue is the amount of money the team or organization takes in from customers or patrons. Profit = Revenue – Costs. Without profit or at least break-even, the business will shut-down.
5. Safety
- Number of injuries or incidents that have occurred within a given time period. Should also include quantified assessments of potential risks and risk mitigation plans. The time to address safety issues are before an incident occurs!
6. Shared values
- Do team members share the same organizational values? To the extent that they do not, may have trouble getting along and working together.
7. Team member turnover
- Ratio of the number of team members that leave the team to the number of team members still on the team for a given period of time. If the number is “high” or trending up, may indicate that there are problems within the team.
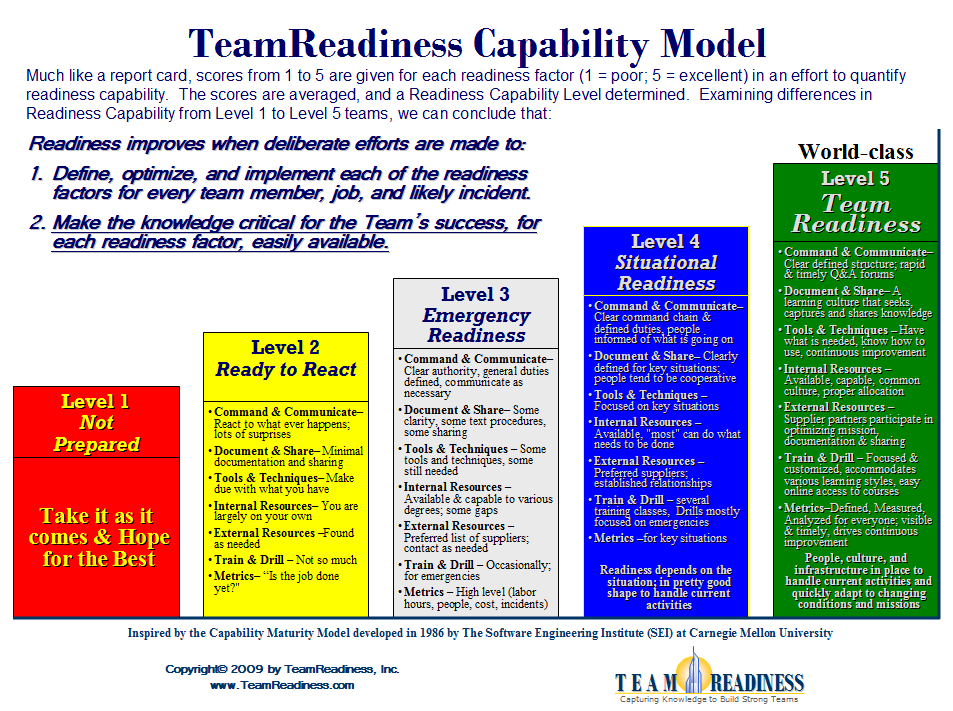
8. TeamReadiness Capability
- Average of the input values from each component of the TeamReadiness Capability Model: Command & Communicate, Document & Share, Tools & Techniques, Internal Resources, External Resources, Train & Drill, and Metrics. A score of 3 or less indicates problems.
(Click image to enlarge)
9. Time to complete a task
- The time it takes for a task or job to get done. May also be called lead time, cycle time, etc.. Often an actual time is compared to an estimated time based on theoretical predictions or the average time the job usually takes. When the actual exceeds the estimated it may indicate problems.
10. Time-to-Readiness
- The time it takes for a team member to acquire the skills and experience necessary to achieve perfect job fulfillment for a particular job. This can be the time it takes for a new team member to be able to perform their particular duties or the time it takes for a team member to learn a new task.
DMW
Copyright © 2007-2011 TeamReadiness, Inc.


